
-
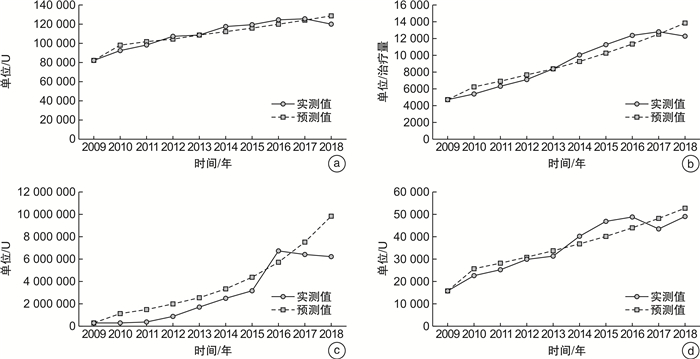
摘要: 目的 建立大连市年度临床供血量数据预测模型,为制定献血者招募计划和血液成分制备计划提供科学依据。方法 应用SPSS 22.0中灰色预测模型GM(1,1),对2009—2018年大连市红细胞、新鲜冰冻血浆、血小板和冷沉淀年度临床供血量进行统计累加,产生一定规律的序列,得到原始序列的估计值,建立微分方程即预测数据模型;回代预测2009—2018年各血液成分的临床用量,进行拟合精度检验。结果 红细胞临床供血量预测模型为 $\hat{x}^{(1)}(t+1)=2823845.09 e 0.034 t-2742150.09 $,2009—2018年红细胞供血量的标准差Sx=14 650.03,误差数列e(t)的标准差Se=2 343.55,后验差比值C=0.159 97,所有$|e(t)-\bar{e}| $均 < 0.674 5Sx=9 881.45,小误差概率P=1.00。血小板临床用供血量预测模型为$\hat{x}^{(1)}(t+1) $=58 875.37e0.1t—54 210.37,2009—2018年血小板供血量的标准差Sx=3 064.69,误差数列e(t)的标准差Se=444.06,后验差比值C=0.144 90,所有$|e(t)-\bar{e}| $均 < 0.674 5,Sx=2 067.13,即小误差概率P=1.00。新鲜冰冻血浆临床供血量预测模型为$\hat{x}^{(1)}(t+1) $=3 535 926.55e0.273t—3 279 035.55,2009—2018年新鲜冷冻血浆供血量的标准差Sx=2 675 310.31,误差数列e(t)的标准差Se=888 183.60,后验差比值C=0.331 99,其中1个$|e(t)-\bar{e}| $≥0.6 74 5Sx=1 804 496.80,P=0.89。冷沉淀临床用供血量预测模型为$\hat{x}^{(1)}(t+1) $=272 229.72e0.09t—256 499.72,2009—2018年冷沉淀供血量的标准差Sx=11 926.45,误差数列e(t)的标准差Se=1 694.53,后验差比值C=0.142 08,所有$|e(t)-\bar{e}| $均 < 0.674 5Sx=8 044.39,即小误差概率P=1.00。结论 采用灰色预测模型GM(1,1) 建立预测大连市年度各种血液成分临床供血量预测模型,拟合效果十分理想,为大连市开展无偿献血招募和血液成分制备提供科学依据。
-
关键词:
- 年度供血量 /
- 灰色预测模型GM(1,1) /
- 统计分析 /
- 供血计划 /
- 预测数据模型
Abstract: Objective To establish the prediction model of annual clinical blood supply-demand in Dalian city in order to provide scientific basis for organizing blood donor recruitment and making blood component preparation plan.Methods The grey prediction model GM(1, 1) in SPSS 22.0 was used to statistically accumulate the annual clinical blood supply of red blood cells(RBC), fresh frozen plasma(FFP), platelets and cryoprecipitate in Dalian from 2009 to 2018, generated a certain regular sequence, obtained the estimated value of the original sequence, and then established the differential equation, so called the prediction data model. The model was used to predict the clinical dosage of each blood component from 2009 to 2018 and analyzed with the fitting accuracy test.Results The prediction model of RBC clinical dosage was $ \hat{x}^{(1)}(t+1)$=2 823 845.09e0.034t-2 742 150.09. The standard deviation of clinical RBC blood supply was 14 650.03, the standard deviation of error sequence e(t) was 2 343.55, the posterior error ratio was 0.159 97, all the values of $|e(t)-\bar{e}| $ were less than 0.674 5, Sx was equal to 9 881.45, and the small error probability was equal to 1 from 2009 to 2018. The prediction model of platelet clinical dosage was $ \hat{x}^{(1)}(t+1)$=58 875.37e0.1t—54 210.37. The standard deviation of clinical platelets dosage was 3 064.69, the standard deviation of error sequence e(t) was 444.06, the posterior error ratio was 0.144 90, all the values of $|e(t)-\bar{e}| $ < 0.674 5, Sx was equal to 2 067.13, and the small error probability was equal to 1 from 2009 to 2018. The standard deviation of clinical FFP dosage was 2 675 310.31, the standard deviation of error sequence e(t) was 888 183.60, the posterior error ratio was 0.331 99. One of the $|e(t)-\bar{e}| $ values was greater than 0.674 5, Sx was equal to 1 804 496.80, and the small error probability was equal to 0.89 from 2009 to 2018. The prediction model of FFP clinical dosage was $\hat{x}^{(1)}(t+1) $=3 535 926.55e0.273t—3 279 035.55.The prediction model of clinical cryoprecipitate dosage was $\hat{x}^{(1)}(t+1) $=272 229.72e0.09t—256 499.72. The standard deviation of clinical cryoprecipitate dosage was 11 926.45, the standard deviation of error sequence e(t) was 1 694.53, the posterior error ratio was 0.142 08, all the values of $|e(t)-\bar{e}| $ were less than 0.674 5, Sx was equal to 8 044.39, and the small error probability was equal to 1 from 2009 to 2018.Conclusion The prediction model of annual clinical blood supply of various blood components created by the gray prediction model GM(1, 1) was very useful to provided scientific basis for the recruitment of voluntary blood donors and the preparation of blood components when evaluated by the fitting effect test. -

-
表 1 2009—2018年我市各种血液成分临床供血量
年份 红细胞/U 血小板/治疗量 新鲜冰冻血浆/U 冷沉淀/U 2009 81 695 4 665 2 569 15 730 2010 92 420 5 373 2 605 22 698 2011 98 104 6 296 3 221 25 294 2012 106 918 7 082 8 278 29 912 2013 108 493 8 289 17 042 31 340 2014 117 188 9 984 24 295 40 194 2015 119 107 11 199 31 584 46 922 2016 124 165 12 298 67 006 48 698 2017 125 375 12 742 64 194 43 480 2018 120 034 12 226 62 201 49 015  下载: 导出CSV
表 2 2009—2018年红细胞用量GM(1,1)模型计算结果
年份 t 实测值X(0)/t 累加值X(1)/t 累加均值z/t 预测值(0)(t) 误差e/t $|e(t)-\bar{e}| $ 2009 1 81 695 81 695 - - - - 2010 2 92 420 174 115 127 905.0 97 661.57 5 241.57 1 510.29 2011 3 98 104 272 219 223 167.0 101 039.16 2 935.16 796.12 2012 4 106 918 379 137 325 678.0 104 533.56 2 384.44 1 346.84 2013 5 108 493 487 630 433 383.5 108 148.81 344.19 3 387.09 2014 6 117 188 604 818 546 224.0 111 889.09 5 298.91 1 567.63 2015 7 119 107 723 925 664 371.5 115 758.73 3 348.27 383.01 2016 8 124 165 848 090 786 007.5 119 762.21 4 402.79 671.51 2017 9 125 375 973 465 910 777.5 123 904.13 1 470.87 2 260.41 2018 10 120 034 1 093 499 1 033 482.0 128 189.31 8 155.31 4 424.03
下载: 导出CSV
表 3 2009—2018年血小板临床用量GM(1,1)模型计算结果
年份 t 实测值X(0)/t 累加值X(1)/t 累加均值z/t 预测值(0)(t) 误差e/t $|e(t)-\bar{e}| $ 2009 1 4 665 4 665 - - - - 2010 2 5 373 10 038 7 351.50 6 191.98 818.98 97.20 2011 3 6 296 16 334 13 186.00 6 843.19 547.19 174.59 2012 4 7 082 23 416 19 875.00 7 562.90 480.90 240.88 2013 5 8 289 31 705 27 560.50 8 358.29 69.29 652.49 2014 6 9 984 41 689 36 697.00 9 237.34 746.66 24.88 2015 7 11 199 52 888 47 288.50 10 208.84 990.16 268.38 2016 8 12 298 65 186 59 037.00 11 282.52 1 015.48 293.70 2017 9 12 742 77 928 71 557.00 12 469.11 272.89 448.89 2018 10 12 226 90 154 84 041.00 13 780.50 1 554.50 832.72
下载: 导出CSV
表 4 2009—2018年新鲜冰冻血浆临床用量GM(1,1)模型计算结果
年份 t 实测值X(0)/t 累加值X(1)/t 累加均值z/t 预测值(0)(t) 误差e/t $|e(t)-\bar{e}| $ 2009 1 256 891 256 891 - - - - 2010 2 260 540 517 431 387 161 1 109 928.21 849 388.21 446 752.88 2011 3 322 130 839 561 678 496 1 458 334.95 1 136 204.95 159 936.14 2012 4 827 760 1 667 321 1 253 441 1 916 106.64 1 088 346.64 207 794.45 2013 5 1 704 200 3 371 521 2 519 421 2 517 572.99 813 372.99 482 768.10 2014 6 2 429 460 5 800 981 4 586 251 3 307 839.76 878 379.76 417 761.33 2015 7 3 158 350 8 959 331 7 380 156 4 346 171.48 1 187 821.48 108 319.61 2016 8 6 700 640 15 659 971 12 309 651 5 710 435.77 990 204.23 305 936.86 2017 9 6 419 430 22 079 401 18 869 686 7 502 942.95 1 083 512.95 212 628.14 2018 10 6 220 080 28 299 481 25 189 441 9 858 118.58 3 638 038.58 2 341 897.49
下载: 导出CSV
表 5 2009—2018年冷沉淀临床用量GM(1,1)模型计算结果
年份 t 实测值X(0)/t 累加值X(1)/t 累加均值z/t 预测值(0)(t) 误差e/t $|e(t)-\bar{e}| $ 2009 1 15 730 15 730 - - - - 2010 2 22 698 38 428 27 079.00 25 637.04 2 939.04 605.36 2011 3 25 294 63 722 51 075.00 28 051.39 2 757.39 787.01 2012 4 29 912 93 634 78 678.00 30 693.11 781.11 2763.29 2013 5 31 340 124 974 109 304.00 33 583.61 2 243.61 1 300.79 2014 6 40 194 165 168 145 071.00 36 746.32 3 447.68 96.72 2015 7 46 922 212 090 188 629.00 40 206.88 6 715.12 3 170.72 2016 8 48 698 260 788 236 439.00 43 993.33 4 704.67 1 160.27 2017 9 43 480 304 268 282 528.00 48 136.38 4 656.38 1 111.98 2018 10 49 015 353 283 328 775.50 52 669.58 3 654.58 110.18
下载: 导出CSV
-
[1] 马文文, 王梦圆, 赵秩轮, 等. 血液需求数据模型研究[J]. 中国输血杂志, 2015, 28(6): 740-743.
[2] 付涌水, 耿鸿武, 骆群, 等. 中国输血行业发展报告(2020)[M]. 北京: 社会科学文献出版社, 2020: 11-12.
[3] 蒋延军, 李运德, 李树德, 等. 基于灰色GM(1, 1)模型的桂林市GDP预测研究[J]. 桂林航天工业学院学报, 2022, 4(108): 533-538. https://www.cnki.com.cn/Article/CJFDTOTAL-NMSH200705016.htm
[4] 贾丹丹, 陈用贵, 周助人. 灰色预测模型在我国年采血量预测中的应用初探[J]. 中国卫生统计, 2012, 29(3): 414-415. doi: 10.3969/j.issn.1002-3674.2012.03.039
[5] 袁玉荣, 高均翠, 卢伟, 等. 探讨ARIMA模型在红细胞用量预测中的应用[J]. 临床血液学杂志, 2017, 30(8): 597-599. https://www.cnki.com.cn/Article/CJFDTOTAL-LCXZ201708006.htm
[6] 谢淑红, 张思静, 王明元, 等. 基于ARIMA模型的苏州市区血浆类成分血临床需求预测研究[J]. 中国输血杂志, 2021, 34(12): 1370-1373. https://www.cnki.com.cn/Article/CJFDTOTAL-BLOO202112024.htm
[7] 何涛, 毛伟, 余泽波, 等. 临床用血季节性特征分析及未来用血趋势预测[J]. 中国输血杂志, 2018, 31(11): 1277-1280. https://www.cnki.com.cn/Article/CJFDTOTAL-BLOO201811024.htm
[8] 周静. 季节周期回归模型在预测临床用血量中的应用[J]. 中国输血杂志, 2008, 21(5): 375-376. https://www.cnki.com.cn/Article/CJFDTOTAL-BLOO200805024.htm
[9] 孙国栋, 李俊霞, 陈慧, 等. 基于时间序列模型的邯郸地区临床用红细胞分析及预测的初步研究[J]. 中国输血杂志, 2015, 28(11): 1361-1363. https://www.cnki.com.cn/Article/CJFDTOTAL-BLOO201511026.htm
-
图(1)
表(5)
计量
- 文章访问数: 761
- PDF下载数: 1817
- 施引文献: 0