
Expression of serum TIM-3 and IL-10 in myelodysplastic syndrome and their relationship with severity of disease and clinical prognosis
-
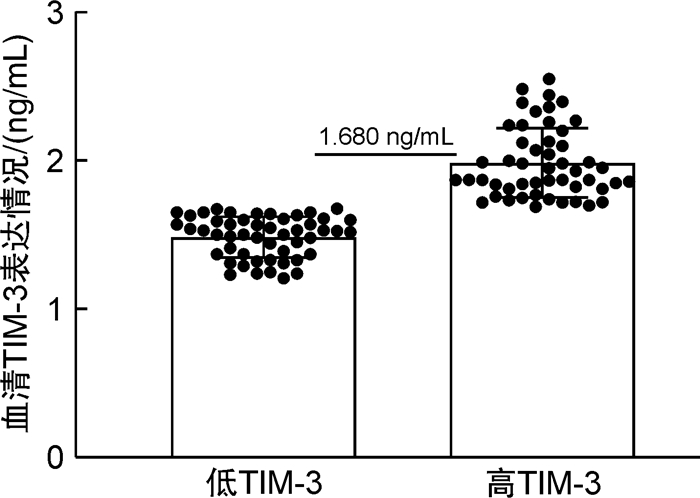
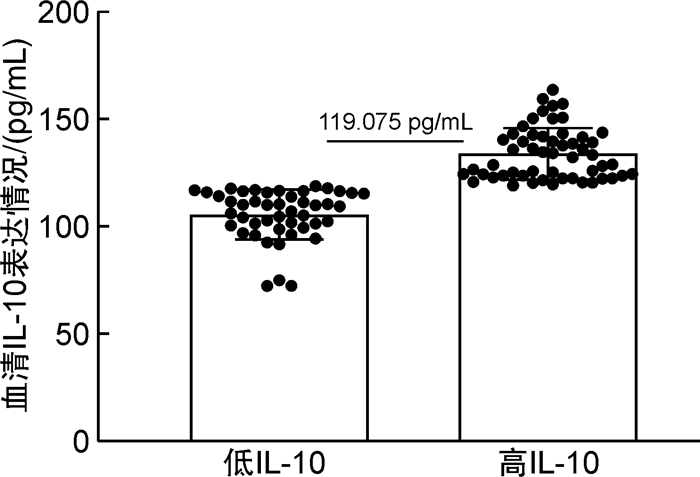
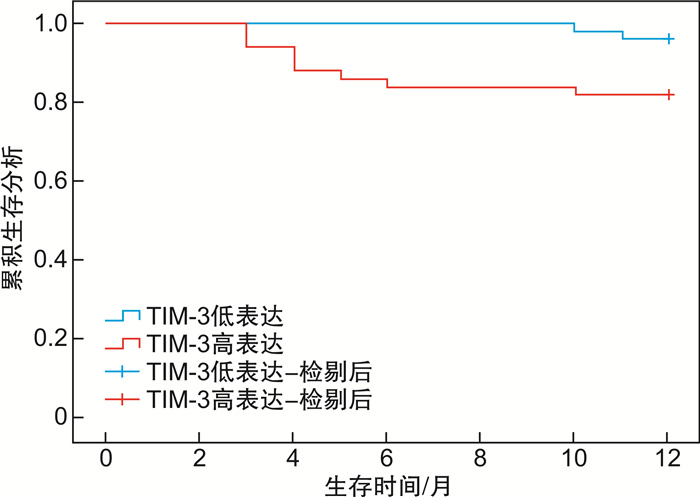
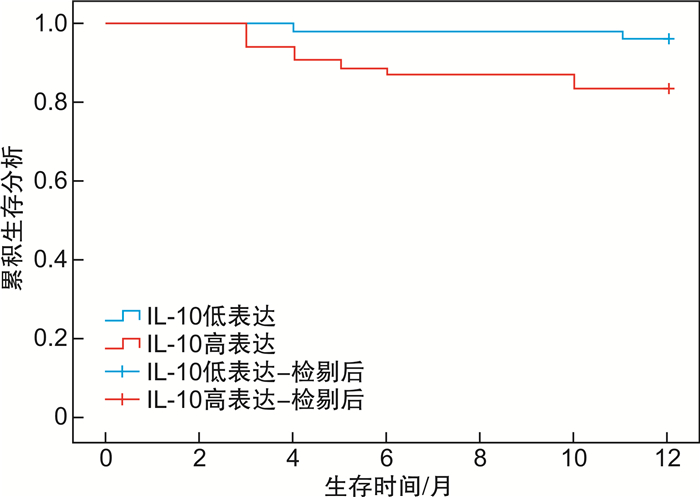
摘要: 目的 分析血清T细胞免疫球蛋白黏液素3(T cell immnoglobulin and mucin 3,TIM-3)、白细胞介素-10(interleukin,IL-10)在骨髓增生异常综合征(myelodysplastic syndrome,MDS)患者中表达,并验证2项指标与患者病情程度及临床预后的关系。方法 回顾性分析2016年7月-2021年7月收治的100例MDS患者临床资料。根据患者病情程度[参照骨髓增生异常综合征国际预后评分系统(IPSS)、WHO的预后积分系统(WPSS)、修订的IPSS(IPSS-R)评定]分为相对低危组和相对高危组。同时查阅及统计患者基线资料、血清TIM-3、IL-10水平。比较2组患者血清TIM-3、IL-10水平。根据IPSS、WPSS及IPSS-R分期对治疗前血清TIM-3、IL-10水平绘制受试者工作特征曲线图分析,根据最佳截断值分为TIM-3与IL-10高表达组和低表达组;比较不同血清TIM-3、IL-10表达情况的MDS患者基线资料及IPSS、WPSS及IPSS-R评分情况。同时查阅患者随访1年(截至2022年7月)的结果,比较不同TIM-3、IL-10表达情况的MDS患者生存情况。结果 100例患者中相对低危组38例,相对高危组62例;相对高危组血清TIM-3、IL-10水平均高于相对低危组(P < 0.05)。按TIM-3为1.680 ng/mL分组,TIM-3高表达组50例,TIM-3低表达组50例;按IL-10为119.075 pg/mL分组,IL-10高表达组54例,IL-10低表达组46例。不同血清TIM-3、IL-10水平患者性别、年龄、FAB分型情况及治疗前白细胞、血小板、血红蛋白水平比较,差异无统计学意义(P>0.05)。TIM-3高表达组IPSS、WPSS及IPSS-R评分高危占比均高于TIM-3低表达组,IL-10高表达组IPSS、WPSS及IPSS-R评分高危占比均高于IL-10低表达组(P < 0.05)。血清TIM-3高表达的MDS患者1年生存时间(10.68±0.42)个月,明显低于低表达患者(11.94±0.04)个月(χ2=5.192,P=0.023)。IL-10高表达的MDS患者1年生存时间(10.89±0.37)个月,明显低于低表达患者(11.80±0.17)个月(χ2=3.888,P=0.049)。结论 血清TIM-3、IL-10在MDS患者中表达存在一定的差异性,其中TIM-3高表达与IL-10高表达提示患者病情较重、预后较差。
-
关键词:
- 骨髓增生异常综合征 /
- T细胞免疫球蛋白黏液素3 /
- 白细胞介素-10 /
- 病情程度 /
- 生存时间
Abstract: Objective To analyze the expression of serum T-cell immunoglobulin mucin 3(TIM-3) and interleukin-10(IL-10) in the patients with myelodysplastic syndrome(MDS), and verify the relationship between the two indexes and the severity of the disease and clinical prognosis.Methods The clinical data of 100 MDS patients admitted to the hospital from July 2016 to July 2021 were analyzed retrospectively. The patients were divided into relatively low risk group and relatively high risk group according to the degree of illness(with reference to the International Prognosis Scoring System[IPSS] for myelodysplastic syndromes, the WHO Prognosis Scoring System[WPSS], and the revised IPSS-R evaluation). At the same time, the baseline data, serum TIM-3 and IL-10 levels of patients were reviewed and counted. The serum TIM-3 and IL-10 levels were compared between the two groups. According to IPSS, WPSS and IPSS-R stages, the levels of TIM-3 and IL-10 in serum before treatment were analyzed by receiver operating characteristic curve. According to the best cut-off value, TIM-3 and IL-10 were divided into high expression group and low expression group. The baseline data and IPSS, WPSS and IPSS-R scores of MDS patients with different serum TIM-3 and IL-10 expressions were compared. At the same time, the patients were followed up for 1 year(the end time was July 2022), and the survival of MDS patients with different expressions of TIM-3 and IL-10 were compared.Results Among the 100 patients, 38 were in the relatively low-risk group and 62 in the relatively high-risk group. The serum TIM-3 and IL-10 levels in the relatively high-risk group were higher than those in the relatively low-risk group(P < 0.05). According to the TIM-3 ratio of 1.680 ng/mL, 50 patients were in the TIM-3 high expression group and 50 patients in the TIM-3 low expression group. According to the IL-10 level of 119.075 pg/mL, 54 cases were in the IL-10 overexpression group and 46 cases were in the IL-10 low expression group. There was no statistical significant difference in sex, age, FAB classification and WBC, BPC, HGB levels before treatment among patients with different serum TIM-3 and IL-10 levels(P>0.05). The high risk proportion of IPSS, WPSS and IPSS-R scores in TIM-3 high expression group was higher than that in TIM-3 low expression group, and the high risk proportion of IPSS, WPSS and IPSS-R scores in IL-10 high expression group was higher than that in IL-10 low expression group(P < 0.05). The 1-year survival time of MDS patients with high serum TIM-3 expression was(10.68±0.42) months, which was lower than that of patients with low serum TIM-3 expression(11.94±0.04) months(χ2=5.192, P=0.023). The 1-year survival time of MDS patients with high expression of IL-10 was(10.89±0.37) months, which was lower than that of patients with low expression of IL-10(11.80±0.17) months(χ2=3.888, P=0.049).Conclusion There were some differences in the expression of TIM-3 and IL-10 in serum of MDS patients. The high expression of TIM-3 and IL-10 might suggest that the patients have a severe disease and a poor prognosis. -

-
表 1 不同病情程度患者血清TIM-3、IL-10水平
X±S 组别 例数 TIM-3/(ng/mL) IL-10/(pg/mL) 相对低危组 38 1.53±0.14 108.88±14.96 相对高危组 62 1.87±0.32 128.63±16.15 t 6.084 6.218 P < 0.001 < 0.001  下载: 导出CSV
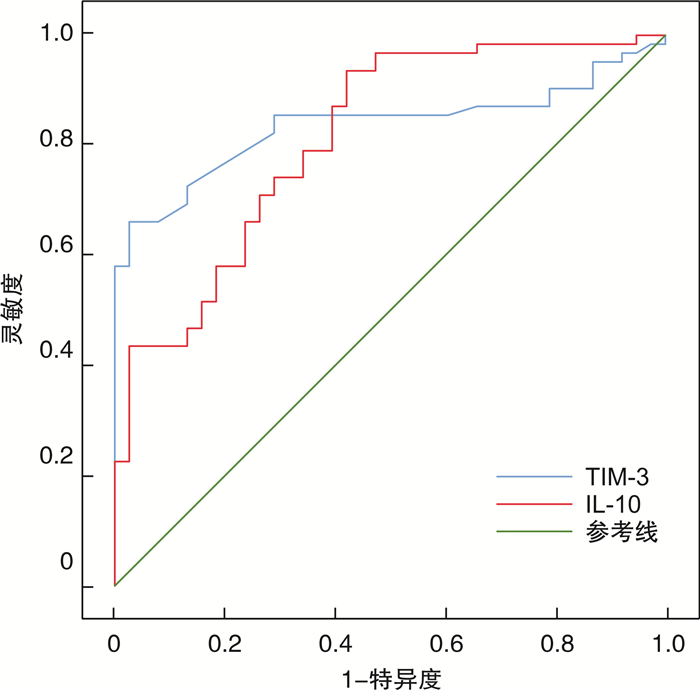
表 2 治疗前血清TIM-3、IL-10水平ROC曲线分析
指标 AUC 95%CI 最佳截断值 P 敏感度 特异度 约登指数 TIM-3 0.836 0.756~0.917 1.680 ng/mL < 0.001 0.726 0.868 0.594 IL-10 0.813 0.727~0.899 119.075 pg/mL < 0.001 0.710 0.737 0.447
下载: 导出CSV
表 3 不同血清TIM-3、IL-10水平患者治疗前相关资料比较
例(%) 项目 例数 TIM-3 χ2 P IL-10 χ2 P 高表达(n=50) 低表达(n=50) 高表达(n=54) 低表达(n=46) 性别 0.047 0.829 0.299 0.585 男 69 35(70.00) 34(68.00) 36(66.67) 33(71.74) 女 31 15(30.00) 16(32.00) 18(33.33) 13(28.26) 年龄/岁 0.762 0.383 0.276 0.599 ≤60 30 13(26.00) 17(34.00) 15(27.78) 15(32.61) >60 70 37(74.00) 33(66.00) 39(72.22) 31(67.39) FAB分型 7.254 0.123 3.394 0.494 RA 43 19(38.00) 24(48.00) 26(48.15) 17(36.96) RAS 15 8(16.00) 7(14.00) 5(9.26) 10(21.74) RAEB 25 14(28.00) 11(22.00) 14(25.93) 11(23.91) RAEB-t 13 5(10.00) 8(16.00) 7(12.96) 6(13.04) CMML 4 4(8.00) 0 2(3.70) 2(4.35) WBC/(×109/L) 0.071 0.790 0.979 0.322 < 4 83 42(84.00) 41(82.00) 42(77.78) 31(67.39) ≥4 17 8(16.00) 9(18.00) 12(22.22) 5(10.87) BPC/(×109/L) 0.932 0.334 0.182 0.670 < 100 78 41(82.00) 37(74.00) 43(79.63) 35(76.09) ≥100 22 9(18.00) 13(26.00) 11(20.37) 11(23.91) HGB/(g/L) 0.285 0.594 0.351 0.554 < 90 71 36(72.00) 35(70.00) 37(68.52) 34(73.91) ≥90 29 13(26.00) 16(32.00) 17(31.48) 12(26.09)
下载: 导出CSV
表 4 不同血清TIM-3、IL-10水平下IPSS、WPSS及IPSS-R评分
例(%) 项目 TIM-3 χ2 P IL-10 χ2 P 高表达(n=50) 低表达(n=50) 高表达(n=54) 低表达(n=46) IPSS/分 41.674 < 0.001 30.034 < 0.001 0~1.0 5(10.00) 33(66.00) 10(18.52) 28(60.87) 1.5~2.0 19(38.00) 15(30.00) 10(18.52) 13(28.26) ≥2.5 26(52.00) 2(4.00) 34(62.96) 5(10.87) WPSS/分 38.503 < 0.001 31.637 < 0.001 0~2.0 5(10.00) 33(66.00) 10(18.52) 28(60.87) 3.0~4.0 18(36.00) 13(26.00) 15(27.78) 16(34.78) 5.0 27(54.00) 4(8.00) 29(53.7) 2(4.35) IPSS/分 36.115 < 0.001 26.834 < 0.001 ≤4.5 5(10.00) 31(62.00) 10(18.52) 26(56.52) >4.5~6.0 18(36.00) 15(30.00) 16(29.63) 17(36.96) >6.0 27(54.00) 4(8.00) 28(51.85) 3(6.52)
下载: 导出CSV
-
[1] Cazzola M. Myelodysplastic Syndromes[J]. N Engl J Med, 2020, 383(14): 1358-1374. doi: 10.1056/NEJMra1904794
[2] 杨倩, 冯献启, 聂淑敏, 等. 中高危骨髓增生异常综合征转化为急性髓系白血病的高危因素[J]. 中国实验血液学杂志, 2020, 28(2): 558-566. doi: 10.19746/j.cnki.issn1009-2137.2020.02.034
[3] Hospital MA, Vey N. Myelodysplastic Syndromes: How to Recognize Risk and Avoid Acute Myeloid Leukemia Transformation[J]. Curr Oncol Rep, 2020, 22(1): 4. doi: 10.1007/s11912-020-0869-0
[4] 姚文亚. 骨髓增生异常综合征患者血清LDH、SF、Th17水平变化及临床价值[J]. 临床血液学杂志, 2022, 35(4): 264-267. https://lcxy.whuhzzs.com/article/doi/10.13201/j.issn.1004-2806.2022.04.007
[5] Durrani J, Groarke EM. Clonality in immune aplastic anemia: Mechanisms of immune escape or malignant transformation[J]. Semin Hematol, 2022, 59(3): 137-142. doi: 10.1053/j.seminhematol.2022.08.001
[6] Asayama T, Tamura H, Ishibashi M, et al. Functional expression of Tim-3 on blasts and clinical impact of its ligand galectin-9 in myelodysplastic syndromes[J]. Oncotarget, 2017, 8(51): 88904-88917. doi: 10.18632/oncotarget.21492
[7] Lamprianidou E, Kordella C, Kazachenka A, et al. Modulation of IL-6/STAT3 signaling axis in CD4+FOXP3-T cells represents a potential antitumor mechanism of azacitidine[J]. Blood Adv, 2021, 5(1): 129-142. doi: 10.1182/bloodadvances.2020002351
[8] Han D, Tao J, Fu R, et al. Myeloid-derived suppressor cell cytokine secretion as prognostic factor in myelodysplastic syndromes[J]. Innate Immun, 2020, 26(8): 703-715. doi: 10.1177/1753425920961157
[9] 中华医学会血液学分会. 骨髓增生异常综合征诊断与治疗中国专家共识(2014年版)[J]. 中华血液学杂志, 2014, 35(11): 1042-1048. doi: 10.3760/cma.j.issn.0253-2727.2014.11.023
[10] Young J, Badgery-Parker T, Dobbins T, et al. Comparison of ECOG/WHO performance status and ASA score as a measure of functional status[J]. J Pain Symptom Manage, 2015, 49(2): 258-264. doi: 10.1016/j.jpainsymman.2014.06.006
[11] Greenberg P, Cox C, LeBeau MM, et al. International scoring system for evaluating prognosis in myelodysplastic syndromes[J]. Blood, 1997, 89(6): 2079-2088. doi: 10.1182/blood.V89.6.2079
[12] Malcovati L, Della Porta MG, Strupp C, et al. Impact of the degree of anemia on the outcome of patients with myelodysplastic syndrome and its integration into the WHO classification-based Prognostic Scoring System(WPSS)[J]. Haematologica, 2011, 96(10): 1433-1440. doi: 10.3324/haematol.2011.044602
[13] Greenberg PL, Tuechler H, Schanz J, et al. Revised international prognostic scoring system for myelodysplastic syndromes[J]. Blood, 2012, 120(12): 2454-2465. doi: 10.1182/blood-2012-03-420489
[14] Lu X. Structure and Functions of T-cell Immunoglobulin-domain and Mucin-domain Protein 3 in Cancer[J]. Curr Med Chem, 2022, 29(11): 1851-1865. doi: 10.2174/0929867328666210806120904
[15] 刘琼, 杨歆, 唐简, 等. 慢性乙型肝炎患者外周血单个核细胞Tim-3和血清IL-33表达及临床意义[J]. 中华医院感染学杂志, 2020, 30(13): 2014-2017. https://www.cnki.com.cn/Article/CJFDTOTAL-ZHYY202013022.htm
[16] Yang R, Sun L, Li CF, et al. Galectin-9 interacts with PD-1 and TIM-3 to regulate T cell death and is a target for cancer immunotherapy[J]. Nat Commun, 2021, 12(1): 832. doi: 10.1038/s41467-021-21099-2
[17] Smith CM, Li A, Krishnamurthy N, et al. Phosphatidylserine binding directly regulates TIM-3 function[J]. Biochem J, 2021, 478(17): 3331-3349. doi: 10.1042/BCJ20210425
[18] Serio B, Selleri C, Maciejewski JP. Impact of immunogenetic polymorphisms in bone marrow failure syndromes[J]. Mini Rev Med Chem, 2011, 11(6): 544-552. doi: 10.2174/138955711795843356
[19] Kasamatsu T, Saitoh T, Minato Y, et al. Polymorphisms of IL-10 affect the severity and prognosis of myelodysplastic syndrome[J]. Eur J Haematol, 2016, 96(3): 245-251.
[20] 张青霞, 李晓, 贺琪, 等. 骨髓增生异常综合征患者骨髓异常克隆细胞起源的初步研究[J]. 中国实验血液学杂志, 2011, 19(4): 930-934. https://www.cnki.com.cn/Article/CJFDTOTAL-XYSY201104019.htm
-
图(5)
表(4)
计量
- 文章访问数: 618
- PDF下载数: 286
- 施引文献: 0